Creating a .NET-based Visual Monitoring System for Hadoop
Summary
Generic Hadoop doesn’t provide any out-of-the-box visual monitoring systems that report on the status of all the nodes in a Hadoop cluster. This JNBridge Lab demonstrates how to create a .NET-based monitoring application that utilizes an existing Microsoft Windows product to provide a snapshot of the entire Hadoop cluster in real time.
Download the source code for this lab here, get a PDF of this Lab here.
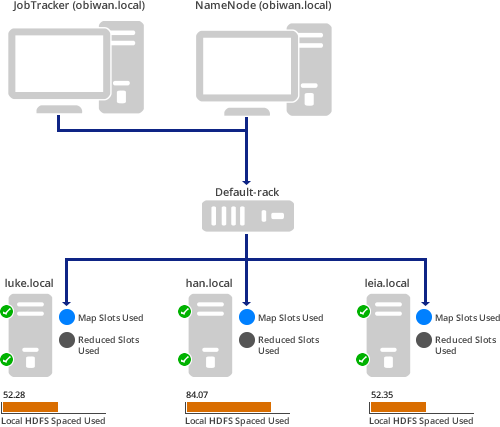
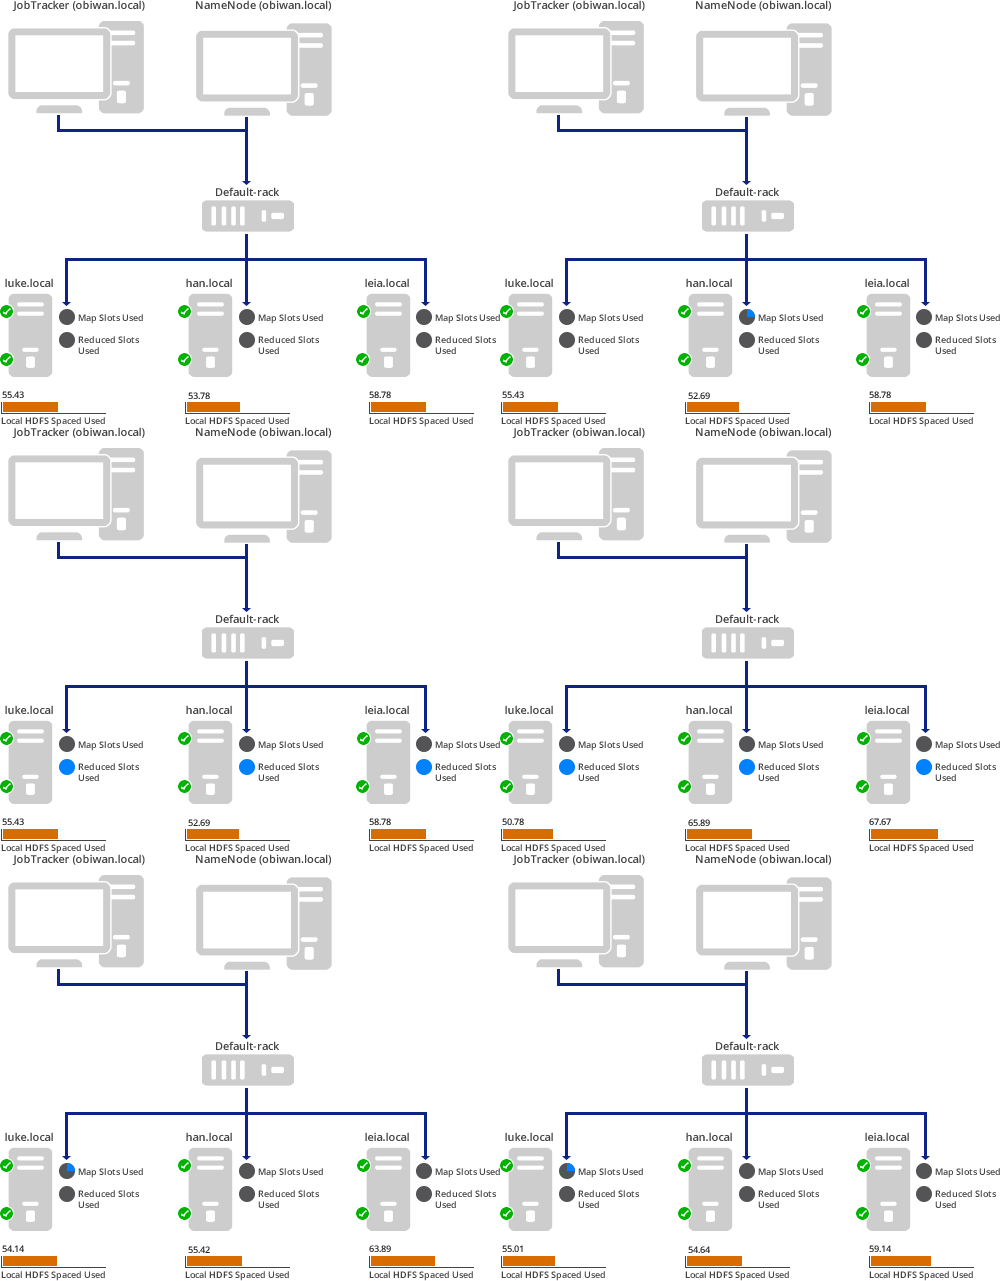
The image below shows a .GIF preview of the app in action.
Introduction
One of the ideals of distributed computing is to have a cluster of machines that is utterly self-monitoring, self-healing, and self-sustaining. If something goes wrong, the system reports it, attempts to repair the problem, and, if nothing works, reports the problem to the administrator — all without causing any tasks to fail. Distributed systems like Hadoop are so popular in part because they approach these ideals to an extent that few systems have before. Hadoop in particular is expandable, redundant (albeit not in a terribly fine-grained manner), easy-to-use, and reliable. That said, it isn’t perfect, and any Hadoop administrator knows the importance of additional monitoring to maintaining a reliable cluster.
Part of that monitoring comes from Hadoop’s built-in webservers. These have direct access to the internals of the cluster and can tell you what jobs are running, what files are in the distributed system, and various other bits of important information, albeit in a somewhat obtuse spreadsheet format. A number of Hadoop packages also come with generic distributed system monitoring apps such as Ganglia, but these aren’t integrated with Hadoop itself. Finally, there are products like Apache Ambari from Hortonworks that do a great deal of visual monitoring, but are tied to particular companies’ versions of Hadoop. In this lab we will look at the basics of producing a custom app that is integrated into the fabric of your own Hadoop cluster. In particular, being JNBridge, we are interested in building a .NET-based monitoring app that interfaces over a TCP connection with Java-based Hadoop using JNBridgePro. To expedite the process of creating a GUI for our monitoring app, we will use Microsoft Visio to easily create a visual model of the Hadoop cluster. This way we can create a rudimentary monitoring app that works as a cluster visualizer as well.
The app that we’re aiming to create for this lab is fairly simple. It will present a graph-like view of the logical topology of the cluster where each worker node displays its status (OK or not OK), the amount of local HDFS space used up, and the portion of Mappers and Reducers that are in use. We’re not looking for hard numbers here — that information is attainable through the webservers — rather, our goal is to create a schematic that can be used to quickly determine the status of various components of the cluster.
Before we begin, please bear in mind two things: 1. We are not proposing our solution or our code as an actual option for monitoring your Hadoop cluster. We are simply proposing certain tools that can be used in the production of your own monitoring app. 2. Our solution was produced for Hortonworks’ HDP 1.3 distribution of Hadoop 1.2.
Even in our limited testing we noticed a distinct lack of portability between different Hadoop distributions and versions — particularly where directory locations and shell-script specifications are concerned. Hopefully our explanations are clear enough that you can adjust to the needs of your own cluster, but that might not always be the case. We’re also going to assume a passing familiarity with Hadoop and Visio, since explaining either system and its internal logic in great detail would make this lab much longer than need be.
What You’ll Need
- Apache Hadoop (we used the Hortonworks distribution, though any will work with some effort)
- Visual Studio 2012
- Microsoft Visio 2013
- Visio 2013 SDK
- JNBridgePro 7.0
Digging into Hadoop
To begin, in order to get as complete information about the cluster as possible, we need to get hold of the NameNode and JobTracker objects — which manage the HDFS and MapReduce portions of Hadoop respectively — that are currently running on the cluster. This will expose the rich APIs of both the JobTracker and the NameNode as well the individual Nodes of the cluster. It’s these APIs that the JSP code uses to create the built-in webserver pages and provides more than enough information for our purposes.
However, accessing these objects directly is somewhat difficult. By and large, Hadoop is built so the end user can only interface with the cluster via particular sockets that only meter certain information about the cluster out and only allow certain information in. Thus getting direct access to and using the APIs of the running NameNode and JobTracker isn’t something that you’re supposed to be able to do. This is a sensible safety precaution, but it makes getting the kind of information required for a monitoring app somewhat complicated. Granted, there is the org.apache.hadoop.mapred.ClusterStatus class that passes status information over the network, but the information it provides isn’t enough to create a truly robust monitoring app. Our solution to this dilemma involves a lightweight hack of Hadoop itself. Don’t worry, you’re not going to need to recompile source code, but some knowledge of that source code and the shell scripts used to run it would be helpful.
Our goal is to wedge ourselves between the scripts that run Hadoop and the process of actually instancing the NameNode and JobTracker. In so doing, we can write a program that breaks through the walled garden and allows us to serve up those objects to the .NET side directly. Technically a similar process could be used to code a similar monitoring app in pure Java, but that’s not what we’re interested in here. If things still seem a little fuzzy, hopefully you’ll get a better idea of our solution as we explain it.
When the $HADOOP_INSTALL/hadoop/bin/hadoop script is called to start the NameNode and JobTracker, it simply runs NameNode.main() and JobTracker.main(). These main functions, in turn, call just a handful of lines of code to start the two master nodes. Note that this process is usually further obfuscated by a startup script such as start-all.sh or, in our case with Hortonworks, hadoop-daemon.sh, but they all ultimately call the same $HADOOP_INSTALL/hadoop/bin/hadoop script. In our solution, instead of having the script call NameNode.main() and JobTracker.main(), we instead call the main functions of our own wrapper classes that contain the code from the original main functions in addition to setting up the remote Java-side servers of JNBridgePro. These wrapper classes are then able to serve up the JobTracker and NameNode instances to our Windows-based monitoring app.
The JobTracker wrapper class looks like this:
import java.io.IOException;
import java.util.Properties;
import org.apache.hadoop.mapred.JobConf;
import org.apache.hadoop.mapred.JobTracker;
import com.jnbridge.jnbcore.server.ServerException;

public class JnbpJobTrackerWrapper {

	private static JobTracker theJobTracker = null;

	public static void main(String[] args) {

		Properties props = new Properties();
		props.put("javaSide.serverType", "tcp");
		props.put("javaSide.port", "8085");
		try {
			com.jnbridge.jnbcore.JNBMain.start(props);
		} catch (ServerException e) {

			e.printStackTrace();
		}

		try {
			theJobTracker = JobTracker.startTracker(new JobConf());
			theJobTracker.offerService();
		} catch (Throwable e) {
			// TODO Auto-generated catch block
			e.printStackTrace();
		}
	}

	public static JobTracker getJobTracker()
	{
		return theJobTracker;
	}
}
And the NameNode wrapper class looks like this:
import java.util.Properties;
import org.apache.hadoop.hdfs.server.namenode.NameNode;
import com.jnbridge.jnbcore.server.ServerException;

public class JnbpNameNodeWrapper {

	private static NameNode theNameNode = null;

	public static void main(String[] args) {

		Properties props = new Properties();
		props.put("javaSide.serverType", "tcp");
		props.put("javaSide.port", "8087");
		try {
			com.jnbridge.jnbcore.JNBMain.start(props);
		} catch (ServerException e) {

			e.printStackTrace();
		}

		try {
			theNameNode = NameNode.createNameNode(args, null);
			if (theNameNode != null)
			{
				theNameNode.join();
			}
		} catch (Throwable e) {
			// TODO Auto-generated catch block
			e.printStackTrace();
		}
	}

	public static NameNode getNameNode()
	{
		return theNameNode;
	}
}
To have the $HADOOP_INSTALL/hadoop/bin/hadoop script call our classes instead, we alter the following lines of code:
elif [ "$COMMAND" = "jobtracker" ] ; then
  #CLASS=org.apache.hadoop.mapred.JobTracker
  CLASS=com.jnbridge.labs.visio.JnbpJobTrackerWrapper
  HADOOP_OPTS="$HADOOP_OPTS $HADOOP_JOBTRACKER_OPTS"
and
elif [ "$COMMAND" = "namenode" ] ; then
#CLASS=org.apache.hadoop.hdfs.server.namenode.NameNode
CLASS=com.jnbridge.labs.visio.JnbpNameNodeWrapper
HADOOP_OPTS="$HADOOP_OPTS $HADOOP_NAMENODE_OPTS"
The replacement lines are right below the commented-out original lines.
In order to finish up the Java side of this solution, we need to add our wrapper classes as well as the JNBridge .jars to the Hadoop classpath. In our case that meant simply adding the wrapper class .jars along with jnbcore.jar and bcel-5.1-jnbridge.jar to the $HADOOP_INSTALL/hadoop/lib directory. Since the Hadoop startup scripts automatically include that directory as part of the Java classpath, we don’t need to do anything else. The startup scripts that came with the Hortonworks distribution work exactly as they did before, and the cluster starts up without a hitch. Only now, our master nodes are listening for method calls from the .NET side of our monitoring app.
Monitoring on the Windows Side
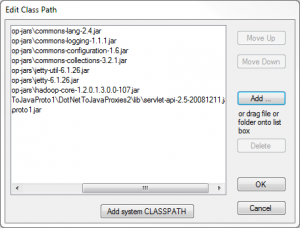
To begin building the Java proxies, we need to add the .jars that contain the appropriate classes to the JNBridge classpath. Below is a screenshot from the JNBridge Visual Studio plugin of the .jars we added to the classpath used to create the proxies. Note that this includes not just the requisite JNBridge .jars and the Hadoop .jars (scraped from the machines in our cluster), but also our wrapper class .jars as well (here called proto1.jar).
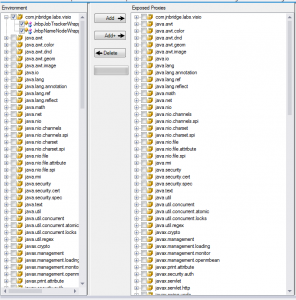
From here we need to actually pick those classes that need to be proxied so that they can be called within our C# code natively. The easiest way to do this is simply select the two wrapper classes (JnbpJobTrackerWrapper and JnbpNameNodeWrapper) in the left window of the JNBridge Visual Studio proxy tool and click the Add+ button. JNBridge will take care of the rest automatically.
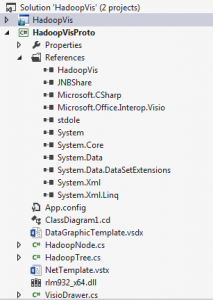
Now we can build the monitoring app itself. When beginning your new project, make sure to add the correct references. You need to reference the correct JNBShare.dll for your version of .NET, the .dll created by the JNBridge proxy process you performed earlier, and the Microsoft.Office.Interop.Visio.dll for your version of Microsoft Visio. We used Visio 2013 for this project along with its SDK (which is a newer version than what came with Visual Studio 2012). Also, be sure to add the JNBridge license .dll to your classpath. Here’s what our references looked like (note that HadoopVis is the name we gave to our Java proxy .dll):
The overall flow of our code is fairly simple: get the JobTracker and NameNode objects, use them to build an internal representation of the cluster, draw that cluster in Visio, and update that drawing with the latest information about the cluster.
In order to get the JobTracker and NameNode objects, we need to connect to the wrapper objects running on our cluster. We do this as follows:
// Connect to the two Java sides
// The jobTracker side is automatically named "default"
JNBRemotingConfiguration.specifyRemotingConfiguration(JavaScheme.binary,
        "obiwan.local", 8085);
// We name the nameNode side "NameNode"
JavaSides.addJavaServer("NameNode", JavaScheme.binary, "obiwan.local", 8087);
Note that we are connecting to two Java sides here even though they are both located on the same physical machine (obiwan.local on our cluster). In JNBridgePro, the system needs to know which Java side to communicate with in order to function properly. If you have an object that exists on one remote JVM and you try to call one of its methods while your code is pointing at a different JVM, your program will crash. To manage this, use the JavaSides.setJavaServer() to point to the correct JVM. You’ll see this sprinkled throughout our code as we switch between pointing to the JobTracker and the NameNode JVMs.
Once we’ve connected to the Java side, we just need to get the objects and build our internal representation of the cluster. The overall program flow looks like this:
JobTracker jobtracker = JnbpJobTrackerWrapper.getJobTracker();
java.util.Collection temp = jobtracker.activeTaskTrackers();
java.lang.Object[] tts = temp.toArray();
JavaSides.setJavaServer("NameNode");
NameNode namenode = JnbpNameNodeWrapper.getNameNode();
HadoopTree.buildTree(jobtracker, "obiwan.local", "obiwan.local", tts,
        namenode.getDatanodeReport(FSConstants.DatanodeReportType.ALL));
// closedFlag is True if a user closes the Visio window in use.
while (!closedFlag)
{
    JavaSides.setJavaServer("NameNode");
    DatanodeInfo[] dnReport = namenode.getDatanodeReport(
            FSConstants.DatanodeReportType.ALL);
    JavaSides.setJavaServer("default");
    HadoopTree.updateTree(jobtracker.activeTaskTrackers().toArray(),
            jobtracker.blacklistedTaskTrackers().toArray(), dnReport);
    System.Threading.Thread.Sleep(3000);
}
The buildTree() and updateTree() methods build and update the internal representation of the cluster and hold it within the HadoopTree class. These methods also invoke the VisioDrawer class that, in turn, draws that internal representation to Visio. We’re not going to go into detail here about how the HadoopTree class builds our internal representation of the cluster. The simple tree-building algorithm we use isn’t terribly pertinent to our current discussion, but we encourage you to look at our code especially if you’re curious about what methods we use to extract information from the JobTracker and NameNode objects (though a few of those methods can be seen in the above code snippet). Keep in mind there are a number of ways to pull information about the cluster from these to objects and we encourage you to explore the published APIs to figure out how to get the information you want for your app. On a side note, the API for the NameNode isn’t currently published as part of the official Hadoop API, so you’ll have to go back to the source code to figure out what methods to call. The API for the NameNode is considerably different from that for the JobTracker too, so don’t expect similar functionality between the two.
Drawing Everything in Visio
Once we have an internal representation of the cluster, we need to draw it in Visio to complete our rudimentary monitoring/visualization app. We begin by opening a new instance of Visio, creating a new Document, and adding a new Page:
// Start application and open new document
VisioApp = new Application();
VisioApp.BeforeDocumentClose += new EApplication_BeforeDocumentCloseEventHandler(quit);
ActiveWindow = VisioApp.ActiveWindow;
ActiveDoc = VisioApp.Documents.Add("");
ActivePage = ActiveDoc.Pages.Add();
ActivePage.AutoSize = true;
We then open our custom network template (which we’ve included with the code for your use) and pull out all the Masters we need to draw our diagram of the Hadoop cluster:
// Open visual templates
networkTemplate = VisioApp.Documents.OpenEx(@"$Template_DirectoryNetTemplate.vstx",
        (short)VisOpenSaveArgs.visOpenHidden);
Document pcStencil = VisioApp.Documents["COMPME_M.VSSX"];
Document networkStencil = VisioApp.Documents["PERIME_M.VSSX"];
Shape PageInfo = ActivePage.PageSheet;
PageInfo.get_CellsSRC((short)VisSectionIndices.visSectionObject,
        (short)VisRowIndices.visRowPageLayout,
        (short)(VisCellIndices.visPLOPlaceStyle)).set_Result(VisUnitCodes.visPageUnits,
                (double)VisCellVals.visPLOPlaceTopToBottom);
PageInfo.get_CellsSRC((short)VisSectionIndices.visSectionObject,
        (short)VisRowIndices.visRowPageLayout,
        (short)(VisCellIndices.visPLORouteStyle)).set_Result(VisUnitCodes.visPageUnits,
                (double)VisCellVals.visLORouteFlowchartNS);
ActivePage.SetTheme("Whisp");

// Get all the master shapes
masterNode = pcStencil.Masters.get_ItemU("PC");
slaveNode = networkStencil.Masters.get_ItemU("Server");
rack = networkStencil.Masters.get_ItemU("Switch");
dynamicConnector = networkStencil.Masters.get_ItemU("Dynamic connector");

// Open data visualization template and shape
slaveBase = VisioApp.Documents.OpenEx(@"$Template_DirectoryDataGraphicTemplate.vsdx",
        (short)Microsoft.Office.Interop.Visio.VisOpenSaveArgs.visOpenHidden);
slaveDataMaster = slaveBase.Pages[1].Shapes[1].DataGraphic;
There are two important things in this snippet that don’t crop up in a lot of examples using Visio. First are these two statements:
PageInfo.get_CellsSRC((short)VisSectionIndices.visSectionObject,
        (short)VisRowIndices.visRowPageLayout,
        (short)(VisCellIndices.visPLOPlaceStyle)).set_Result(VisUnitCodes.visPageUnits,
                (double)VisCellVals.visPLOPlaceTopToBottom);
PageInfo.get_CellsSRC((short)VisSectionIndices.visSectionObject,
        (short)VisRowIndices.visRowPageLayout,
        (short)(VisCellIndices.visPLORouteStyle)).set_Result(VisUnitCodes.visPageUnits,
                (double)VisCellVals.visLORouteFlowchartNS);
These statements tell Visio how to lay out the diagram as it’s being drawn. The first statement tells Visio to create the drawing from top-to-bottom (with the master nodes on top and the slave nodes on the bottom) while the second tells Visio to arrange everything in a flowchart-style pattern (we found this to be the most logical view of the cluster). Logically what we’re doing is editing two values in the current Page’s Shapesheet that Visio refers to when making layout decisions for that Page.
The second thing we want to draw your attention to are these lines:
slaveBase = VisioApp.Documents.OpenEx(@"$Template_DirectoryDataGraphicTemplate.vsdx",
        (short)Microsoft.Office.Interop.Visio.VisOpenSaveArgs.visOpenHidden);
slaveDataMaster = slaveBase.Pages[1].Shapes[1].DataGraphic;
This code opens a prior Visio project (that we’ve also included with our code) where we’ve simply tied a series of DataGraphics to a single Shape. These DataGraphics can then be scraped from the old project and tied to Shapes in our new project. Our prefabricated DataGraphics are used to display information about individual nodes in the cluster including HDFS space, Mappers/Reducers in use, and overall status of the TaskTracker and DataNode. We have to create these DataGraphics ahead of time since they can’t be created programmatically.
We can then draw the cluster on the Page that we’ve created. Again, we are going to skip over this portion of the process since it is largely standard Visio code. The cluster representation is drawn mostly using the Page.DropConnected() method, and since we’ve already told Visio how to format the drawing, we don’t need to mess with its layout too much. All we have to do is call Page.Layout() once all the Shapes have been drawn to make sure everything is aligned correctly.
The last interesting bit we want to touch on is updating the drawing with the most recent data from the cluster. First we need to get the latest data from the cluster and update our internal representation of the cluster:
public static void updateTree(Object[] taskNodeInfo, Object[] deadTaskNodes,
        DatanodeInfo[] dataNodeInfo)
{
    JavaSides.setJavaServer("NameNode");
    foreach (DatanodeInfo dn in dataNodeInfo)
    {
        HadoopNode curNode;
        leaves.TryGetValue(dn.getHostName(), out curNode);
        if (dn.isDecommissioned())
        {
            curNode.dataActive = false;
        }
        else
        {
            curNode.setHDSpace(dn.getRemainingPercent());
            curNode.dataActive = true;
        }
    }
    JavaSides.setJavaServer("default");
    foreach (TaskTrackerStatus tt in taskNodeInfo)
    {
        HadoopNode curNode;
        leaves.TryGetValue(tt.getHost(), out curNode);
        curNode.setMapUse(tt.getMaxMapSlots(), tt.countOccupiedMapSlots());
        curNode.setReduceUse(tt.getMaxReduceSlots(), tt.countOccupiedReduceSlots());
        curNode.taskActive = true;
    }
    foreach (TaskTrackerStatus tt in deadTaskNodes)
    {
        HadoopNode curNode;
        leaves.TryGetValue(tt.getHost(), out curNode);
        curNode.taskActive = false;
    }
    VisioDrawer.updateData(leaves);
}
Once the data has been gathered, the Visio drawing is updated:
public static void updateData(Dictionary<string, HadoopNode> leaves)
{
    foreach (KeyValuePair<string, HadoopNode> l in leaves)
    {
        HadoopNode leaf = l.Value;
        Shape leafShape = leaf.getShape();
        // Update HDFS information
        if (leaf.dataActive)
        {
            leafShape.get_CellsSRC(243, 20, 0).set_Result(0, leaf.getHDSpace());
            leafShape.get_CellsSRC(243, 0, 0).set_Result(0, 1);
        }
        // If the DataNode has failed, turn the bottom checkmark to a red X
        else
        {
            leafShape.get_CellsSRC(243, 0, 0).set_Result(0, 0);
        }
        // Update mapred information
        if (leaf.taskActive)
        {
            leafShape.get_CellsSRC(243, 17, 0).set_Result(0, leaf.getMapUse());
            leafShape.get_CellsSRC(243, 18, 0).set_Result(0, leaf.getReduceUse());
            leafShape.get_CellsSRC(243, 12, 0).set_Result(0, 1);
        }
        // If the Tasktracker has failed, turn the bottom checkmark to a red X
        else
        {
            leafShape.get_CellsSRC(243, 12, 0).set_Result(0, 0);
        }
    }
}
Logically we are just changing certain values in each Shapes’ Shapesheet that are tied to the DataGraphics we added earlier. Which cells of the Shapesheet correspond to which DataGraphic had to be decided in advance when we created the DataGraphic by hand. This way we can address those indices directly in our code.
This updating process (as you saw in an earlier code segment) is done in a simple while loop polling system that updates every three seconds. We used this method rather than a callback/event handling strategy largely for ease of implementation. The NameNode and JobTracker classes don’t implement a listener interface for notifying when values change. As a result, in order to add this functionality, we would have to do significantly more Hadoop hacking than we’ve already done. We could also implement an asynchronous update system in pure C# that would use events to notify the graphic to update, but that would still require polling the Java side for changes somewhere within our program flow. Such a system would lighten the load on Visio by decreasing the number of times we draw to the Page, but wouldn’t increase efficiency overall. While both ways of implementing callbacks are interesting exercises, they’re somewhat outside the scope of this lab.
The Result
For our small, four-virtual-machine cluster, this is the result (as you saw above):
Here a Map/Reduce job is running such that 100% of the Mappers are in use and none of the Reducers are being used yet. Also, notice that the middle worker node has used up almost all of its local HDFS space. That should probably be addressed.
For larger, enterprise-size clusters Visio will likely become an even less viable option for handling the visualization, but for our proof-of-concept purposes it works just fine. For larger clusters, building a visualizer with WPF would probably be the better answer for a .NET-based solution.
We hope this lab has been a springboard for your own ideas related to creating Hadoop monitoring/visualization applications.
~Ian Heinzman

